Author Archives: Jonathan Propp

What a Difference a Year Makes

How things change. Two of my blogs from last March need updating.

Arkansas Medicaid Work Requirements

I wrote about how Arkansas’ implementation of work requirements for Medicaid was designed so poorly that it disenfranchised 18,000 recipients. Obviously, it was designed with little to no concern for the recipients, but instead was designed simply to save money for the state. Last Friday, the New York Times reported that “a three-judge panel of the United States Court of Appeals for the District of Columbia Circuit found that approval of the Arkansas work requirement by the health and human services secretary, Alex M. Azar, was ‘arbitrary and capricious’ because it did not address how the program would promote the objective of Medicaid as defined under federal law: providing health coverage to the poor.” The article continued, “even many Medicaid recipients who had jobs there were either unaware of the rule or confused about how to report their work hours to the state every month.” Oops.

Boeing . . .

If you read my blogs, you know that I’m a bit of an aviation geek and a big fan of Boeing, which has delivered incredibly reliable airplanes for decades. So in the wake of the 737 Max disaster, one has to ask, “What went wrong at Boeing?” Hard to say without being an insider, but parsing through the news reports, I get the impression that the longstanding culture of safety and quality first was compromised in order to rush the 737 Max to market. Boeing was feeling threatened by rivals in the single-aisle jet category and needed an update to the 737. They replaced the existing engines with newer, more fuel-efficient engines. This was obviously a big selling point, but it changed the aerodynamics of takeoff and landing. The software (which, along with a key sensor, proved faulty in the end) was designed to compensate for that.

Two lessons here, I think: First, we all know that product development is all about tradeoffs. Quality and time to market are often opposed to each other. In this case, Boeing felt pressured on time to market and dropped its longstanding safety and quality first approach to product development. The consequences were fatal, and the damage to the company is substantial.

Secondly, we all face choices about when to rearchitect an old product vs. doing a short term fix. The latter is faster in getting to market but tends to lead to problems in the field. This is not only a hardware problem; it happens all the time with software as well. Companies struggle with this decision all the time. It’s worth taking a long-term view when making a tradeoff analysis.

Can We Accelerate Innovation?

We are in an innovation race. Global competition has never been fiercer for companies, and not only in the high technology sector. From food and agriculture, to renewable energy and automobiles, leaders are wondering: How do I accelerate innovation?

Many of them are focusing on the wrong activities. Despite changes in technology, many companies are using outdated approaches to product and service development. As a result, they are missing the real opportunities to accelerate innovation.

Manage the Right Activities

Most companies spend a lot of effort tracking product and service development projects. Once a project is approved for development, it gets tracked (and often led) by a program manager. Status is reported to management, often on a weekly basis. 

New technologies and development methodologies have accelerated project execution. Software development is faster due to error-checking tools, continuous integration and deployment tools, and the widespread adoption of Agile. Hardware development, while still facing the reality of having to build physical things, has been revolutionized by the advent of 3-D printing and fast prototyping. 

Don’t get me wrong: Projects can certainly go off the rails, encounter unexpected technical problems, and end up late – sometimes staggeringly so. (Remember the deployment of the federal health insurance marketplace portal in 2013?) But I think most companies are missing the real opportunities to accelerate innovation:

  • Time to invest
  • Time to define
  • Time to make decisions

Let’s explore each of these in turn. 

1. Time to Invest

Most products are late to market not because of delays in project execution, but rather because it took too long to start the project. Companies don’t invest the time and energy in managing the process before committing. Ideas percolate around, get discussed and fought over, but have a hard time getting funded.

In addition, the tyranny of the annual operating plan often results in product and service proposals being bundled into an end of year request for funding. As markets and competitors move ever faster, this makes less and less sense.

Does your company have a clear process for vetting and funding new ideas? Do you measure the time from idea to funding, rather than from funding to launch? What percentage of people’s time is devoted to these activities?

Some will say there is too much uncertainty about the technology or markets to make an earlier commitment. True – new product and service development is all about managing uncertainty. Are there ways to manage this? Absolutely. And I would contend that the potential benefits — of  hitting the market at an earlier time — often outweigh the risks.

2. Time to Define

You have many design options with any new product or service. Product architects propose subsystems and systems. Product managers propose requirements to meet customer and other needs. Eventually these are solidified into a set of requirements (what the product or service must do) and specifications (how it does them). This activity is often accomplished through proofs of concept (POCs) which allow designs to be tested out. 

You can accelerate this activity with new tools and methodologies. Simulation software can run virtual tests of new hardware and software designs, even complex ones. Online A/B testing allows for quick user feedback on possible features. Applying Agile methods to the design process, through activities such as Design Sprints, increases the sense of urgency and shortens the design time. New capabilities in artificial intelligence allow for the creation and evaluation of multiple designs in a shorter period of time.

How many resources do you devote to these activities? POCs often compete for resources with existing development projects and maintenance of current products. Do you manage these tradeoffs strategically or just respond to them one-by-one? And have you assessed the benefit of investing in and using these new tools?

3. Time to Decision 

Product and service development involves making hundreds of decisions, not only about product definition and technology approaches, but about resources, schedule, pricing and positioning, etc. Sometimes the decision making process seems like it takes longer than the design and development process. 

Most companies are unaware of this opportunity to speed up innovation because they don’t consider it. But I have seen projects slowed down by weeks, even months, waiting for decisions to be made. Often this is because decision making responsibility is unclear — who gets to decide? And when decisions get pushed up the corporate ladder to senior executives with limited bandwidth, it can really slow things down.

Fundamentally, decisions get pushed up the ladder because senior management doesn’t trust people in the organization to make good decisions. But how valid is this? Not all decisions are created equal. The information needed to make a good decision and the risk of making a bad decision can vary widely.

Boundary conditions are a time-tested approach allowing project leaders to know when they can make decisions themselves, and when they need to escalate. Some version of that combined with clear definition of ownership can dramatically improve decision making velocity.

As always, I appreciate your comments on these articles. Contact me if you’re interested in accelerating innovation in your organization.

Au Revoir, Airbus 380

This February Airbus announced that it would phase out production of its 380 double decker jumbo after its main customer, Emirates Airlines, decided to stop buying them. The 380 was a marvelous work of aerospace engineering that lost a lot of money for Airbus.

The development of the 380 roughly paralleled the development of Boeing’s 787 (2001 – 2008). It cost the company about $25 billion to develop. In a well-publicized gaffe, development was delayed by 2 years because of a misalignment of wiring in the plane caused by different development teams using different versions of CAD software.

Airbus’ total deliveries of the 380 will be around 250 planes. It would have needed to make a profit of $90 million per plane in order to break even. Unfortunately, like Boeing, Airbus was probably losing money on every plane shipped, so it will never recoup that original $25 billion investment. 

Again, there were certainly spinoff benefits to Airbus, and the company remains financially strong, in part because of government support. But the opportunity cost remains huge – what else could Airbus have done with that $25 billion that would have been a more profitable investment? And that doesn’t even begin to consider the cost to airports of installing double decker jetways to load and unload the planes.

What went wrong? Airbus badly misread the civil aviation market. It decided that airlines would increasingly want to fly large numbers of people (the plane held more than 500) internationally from hub to hub. But outside of Emirates (their main customer, by far), not many did. Instead, airlines increasingly want to fly smaller, more efficient planes (the 787 has two engines to the 380’s four) from point to point. In this way, Boeing was better at reading the market.

The 380 is a wonderful plane, and many people love flying in it. But it was a bad investment.

Designing Public Services with Customers in Mind

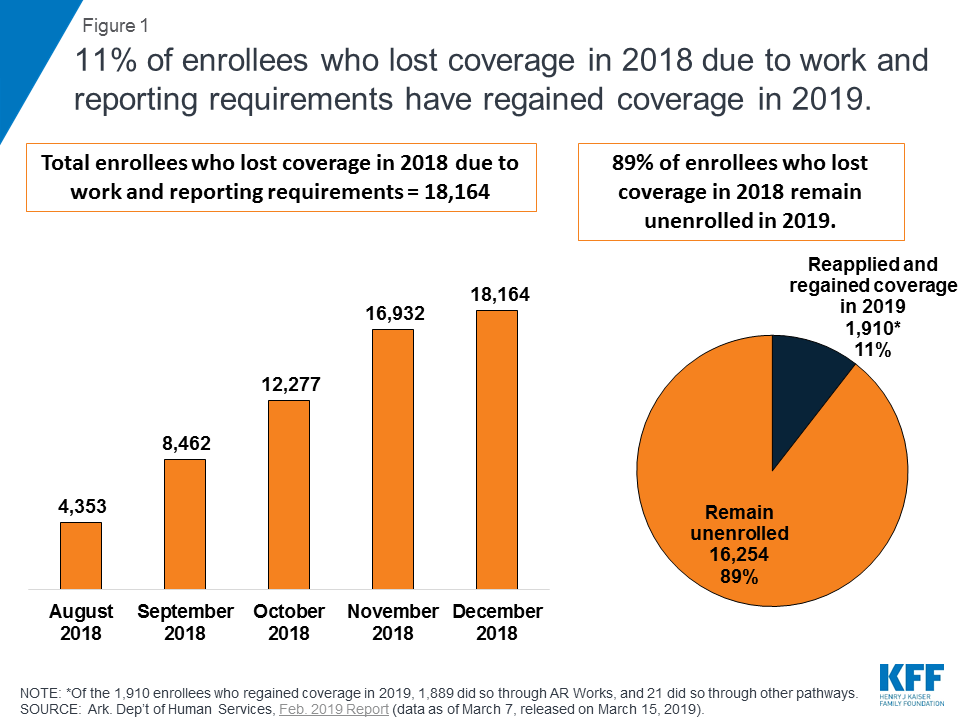
An article in the February 16th issue of The Economist talked about Arkansas’ rollout of work requirements for Medicaid recipients. It makes for depressing reading. 18,000 recipients (about 7% of the total) lost their Medicaid coverage, not because they didn’t qualify, but because the program was poorly designed to meet their needs.

Source: Kaiser Family Foundation

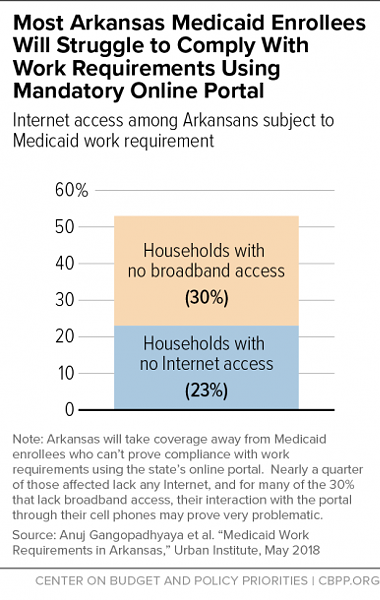
For example, recipients were required to report their work activities online. But more than 20% of recipients lack access to the internet through a computer or a smartphone. Many struggle to find public transportation to a library that has internet access. Even more astounding, the website for reporting shuts down between 9 pm and 7 am, making it largely inaccessible to working people. Letters to recipients documenting the changes in policy had little effect, either because the recipients couldn’t read English adequately, couldn’t understand the writing (have you ever gotten a letter from a public agency?), or were no longer living at the address. 

Most of these people only discovered that they had been dropped from Medicaid when they went to a pharmacy to pick up a prescription and learned that the price had increased considerably.

Did anyone in the Arkansas Department of Human Services actually go talk to or observe a customer, a clinic, doctor, nurse or social worker? It seems unlikely. Anyone who has worked with Medicaid recipients knows that their housing can be insecure (they move frequently, or occasionally go homeless), lack access to public transportation, lack access to the internet (they may have phones, but can only afford limited minutes), lack literacy or language skills, and may have behavioral issues that prevent them from understanding choices. If the state had talked to stakeholders, they could have designed services that met the needs of the users. At least if they had done concept testing, they would have discovered that the proposed services were badly flawed.

Source: Center on Budget and Policy Priorities

There is a better way. An article in the New York Times on March 1 discussed new public housing in the Hackney borough of East London. The architecture firm that was hired by the borough worked closely with current residents (whose old public housing was to be torn down and replaced) to understand their needs. The resulting mid-rise buildings contain subsidized apartments that are light and airy with winter gardens and balconies. Subsidized and market rate apartments share entrances, floors and open spaces, so there is no stigma attached to subsidized housing. 

Public services need not be poorly designed. In fact, many agencies around the country are starting to embrace user-centered design. Sure, funding can be a challenge, but that just places an additional constraint on the design process. Talking to customers and stakeholders while designing public services can improve the lives of millions of Americans.

What’s Your Return on R&D Investment – Part 4

Boeing 787

Here’s a fun one with some big numbers. Boeing started development of the 787 around 2003 and launched it in 2011. While Boeing doesn’t break out R&D spending by project, a study by the Seattle Times estimated the total cost to be around $32 billion. (Clearly, this is not an industry for the faint of heart, or for those with a short term perspective.) So the R&D cost curve was at negative $32 billion in 2011.

So how long did it take Boeing to recoup that cash? There was one problem. Boeing was discounting the planes and not reducing its manufacturing costs fast enough, so for five years, until 2016, it sold each plane at a loss. It delivered about 325 planes at an average loss of $30 million per plane. So at the end of 2015, the R&D cost curve was at a negative $42 billion.

How many planes will Boeing need to sell to get out of that hole? The company estimates making an average profit of $50 million, over 30%, per plane for the next several years. At that rate, the company will need to sell roughly 840 planes to break even. This is about six years of production for the 787. So assuming that demand remains strong, the project will break even in 2022. That’s 11 years after launch. Some analysts think the program will never break even.

Does this matter? Boeing’s stock remains strong, and it recently released strong financials. And a purely financial analysis doesn’t consider all the spinoff benefits of developing a new product. The 787 pioneered the use of new materials (carbon fiber), engines, electronics, ventilation and lighting systems, and much more, that Boeing has then applied to other planes. It also brought along a whole new supply chain of key partners around the world and new information systems for managing all the data involved in developing new products across that supply chain. 

The moral is that financial return is important, but it’s not everything. Also, beware business cases presented at the start of new product development programs that estimate break even time and return on investment. Many things can change, especially the longer the development time. Do multiple iterations of sensitivity analysis (higher R&D cost, higher product cost, lower sales) to assess the risk. I’m sure Boeing does all of this. But even they sometimes get it wrong.

What’s Your Return on R&D Investment? – Part 3

Spotify

Spotify releases multiple software products each year, from website updates to database improvements to streaming software. The goal is to increase subscriber volume, accounting for 90% of revenue, and advertising, which accounts for 10%.

Spotify’s R&D spending was about $500 million in 2017, just under 10% of its revenue. But as a software company, its product development cycle time is much shorter than Apple’s. I’m going to assume that a typical cycle for Spotify is 6 months. That means we’re looking at an investment of $250 million.

How long does it take Spotify to make that investment back? Spotify’s average revenue from a subscriber is $6.50/month, or $78/year. It makes a gross margin of 21% (the reason it’s so low as a software company is because of the royalties it pays), so every new subscriber brings in $16/year. 

Spotify added 26 million new subscribers in 2017, a nearly 50% increase, generating additional profit of $416 million (21% margin x $78). Its base of free users is larger than its base of paid subscribers. Those users see ads that generate about $500 million in annual revenue. I’ll conservatively assume that ad revenue increased 20% in 2017, adding another $100 million (pretty much all profit).

Was all that new business generated by Spotify’s software updates in 2017? Again, it’s impossible to say. But given the fast-paced nature of that industry, and the abundance of competitors, one could argue that Spotify would start to lose, not gain, subscribers pretty quickly if it didn’t keep innovating. 

We also need to take into account lost sales avoided, in other words, the subscribers who would have left Spotify if it were not refreshing its software. Hard to know, but I’ll assume that perhaps 10% of their prior base of 55 million subscribers would have left. At 21% margin, that’s an additional $88 million. 

So Spotify’s $250 million investment pays back just over $600 million in one year, making its time to breakeven just slightly under 6 months. Again, not a bad return on investment.

Next up: Boeing.

What’s Your Return on R&D Investment? – Part 2

Apple iPhone X

The iPhone X is Apple’s flagship product. Its development took roughly two years. How much did Apple spend on its development (in other words, how far into negative territory did the cumulative cost curve go)? Apple spends about $10 billion annually on R&D (6% of revenue), but it doesn’t break this number down by product, so we have to make some guesses.

Apple has R&D investments in a lot of different hardware and software products, not to mention autonomous cars, health applications, online radio and so forth. I’m going to assume that the smartphone business is their largest consumer of R&D, so let’s say 20% of their total cost spend. If we apply that over a two year period, we come up with a number of $4 billion. That’s how deep the cost curve goes before a single phone is sold.

The next question is how many iPhone Xs Apple sold, and at what amount of profit. Here we have better public information. It has been estimated that Apple sold over 12 million in the product’s first quarter and probably as many in the following quarter. Apple makes a gross margin of roughly 64% on the $999 iPhone X.

But wait – are all those iPhone X sales incremental revenue for Apple? How many of those buyers were driven specifically by the features of the iPhone X? In other words, how much of that profit would Apple have foregone if it had not developed the iPhone X? That’s the number we’re looking for.

Obviously, it’s impossible to know the answer to that question, but a key part of it is lost sales prevented. In other words, if Apple had stuck with its line of older smartphones and the Apple 8, how many buyers would have opted instead for Samsung or other competitive phones?

Like I said before, this isn’t easy. But Apple is going to have much better information on all this than I am as an interested observer. I’m sure they have models for how frequently customers upgrade phones and what features are the best sellers.

So let’s just assume that 3 million (25%, probably a conservative estimate) of those first quarter iPhone Xs were truly incremental revenue to Apple, at a profit of $640 per phone. That gives us a profit uptick of $1.9 billion in one quarter. If we assume similar numbers for the iPhone X’s second quarter of sales, that brings us to $3.8 billion, just below our estimated spending of $4 billion.

Apple takes roughly half a year to break even on its R&D investment in the iPhone X. That’s not a bad business to be in.

Next up: Spotify.

What’s Your Return on R&D Investment?

Why don’t more companies measure their return on R&D investment? Every CFO is expected to know the return on a company’s financial investments. Yet they rarely do the same for what is often their biggest investment – developing new products and services.

I think there are three reasons. One is organizational: whose responsibility is it? The CFO? The VP of Engineering? The VP of Product Management? Selecting a portfolio of new products and services to develop is a collaborative effort, but it’s often unclear who owns the overall success of that portfolio.  I find that in companies with a Program Management Office (PMO), they often take measurement responsibilities. Otherwise, it tends to fall through the cracks.

Another reason is that measuring return on R&D investment is not easy. There’s no accepted formula or definition. Collecting the data can be hard (but it’s getting easier). You might have to make some assumptions along the way. It’s easier for hardware companies selling discrete widgets, but for software companies, especially those using a subscription model, it can be downright hard. 

Finally, measuring the return on R&D investment requires a long time horizon. Companies tend to closely track schedule and cost for R&D projects, which are easy to collect in real time. Calculating the return on investment requires looking back some time after the product or service has been released (more on that later). In the meantime, management attention has moved on to other things. So this activity needs to become part of the regular business review cycle, or it just won’t happen.

Why does this matter? I believe that many companies are underperforming in their return on R&D investment, and by actively reviewing this metric, they might determine to make better product and service investment decisions. I can’t think of another part of the enterprise that consumes as much capital and is allowed to run so open loop.

Product Development Lifecycle Economics

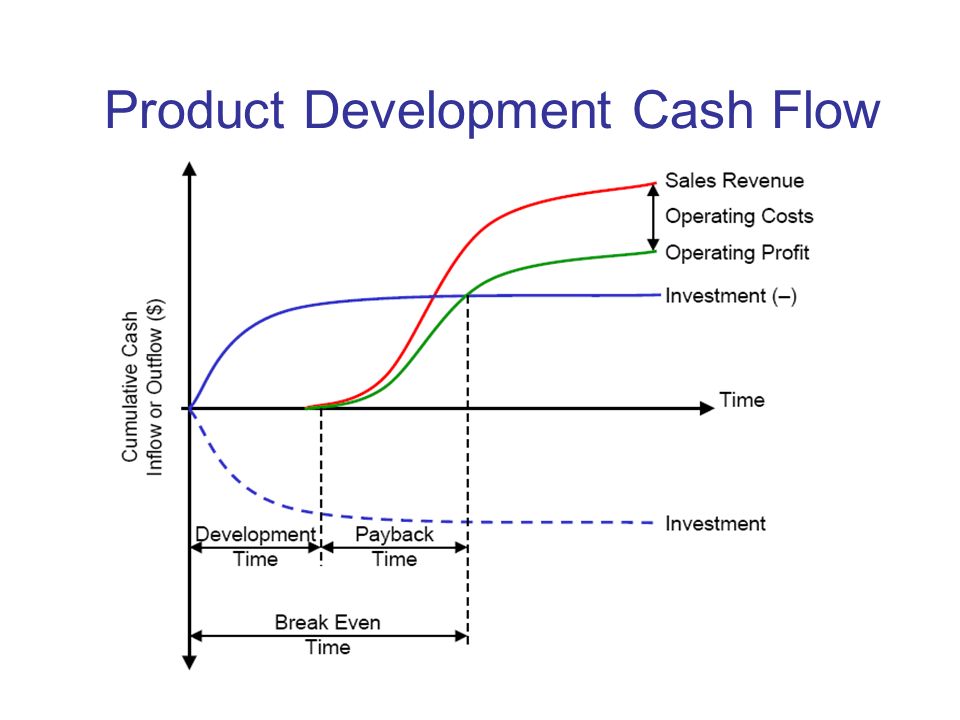
The first thing you need to understand to calculate the return on R&D investment is this chart:


When you develop a new product or service, you spend money, sometimes a lot of money. It has been estimated that Boeing’s 787 aircraft cost more than $30 billion to develop! Most of us are not in that kind of high risk business. But it’s not unusual for a project to consume a few million dollars, even for software. 

How long it takes you to recoup that investment and start turning a profit is a key measurement of R&D effectiveness called Break Even Time (BET). Hewlett-Packard was the first company to start tracking this metric in the 1980s. BET isn’t a detailed return on investment calculation, but as a shorthand gauge of success, it’s quite good. In our next few blogs, we will look at some examples.